Forecasting sales, traffic, or usage trends usually means exporting data, training a model, and maintaining it over time. AI.FORECAST skips that entire process. It is a built-in BigQuery function that predicts future values in a time series using Google’s pretrained TimesFM model, directly from a SQL query, with no model training or management required.
What Is AI.FORECAST in BigQuery
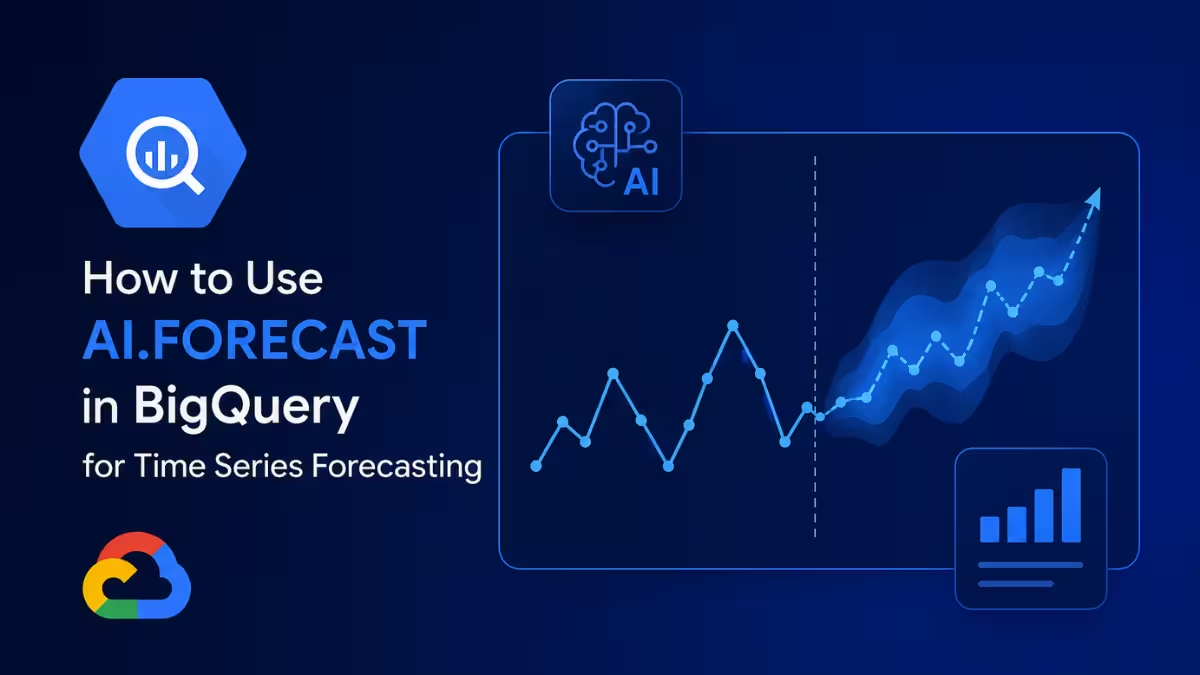
AI.FORECAST is a SQL function in BigQuery ML that generates forecasts directly from a query or table using a pretrained foundation model.
It works by analyzing historical values in a data column against a timestamp column, then projecting future values for a chosen horizon. Because the underlying TimesFM model is pretrained on a large corpus of time series data, it does not need to be trained on your specific dataset before producing predictions. This makes it usable directly through SQL, without a separate machine learning workflow.
Before You Start
You need a Google Cloud project with billing enabled and BigQuery access, along with a dataset that contains a table with at least a timestamp column and a numeric column to forecast. No model training, model creation, or extra API setup is required since AI.FORECAST calls Google’s hosted TimesFM model directly.
AI.FORECAST Syntax
The function is called directly inside a SELECT statement and takes a table or subquery as its main input. The uppercase words below (TABLE, DATA_COL, TIMESTAMP_COL, and so on) are placeholders you replace with your own table name and column names, not literal text to type in.
SELECT
  *
FROM
  AI.FORECAST(
    { TABLE TABLE | (QUERY_STATEMENT) },
    data_col => 'DATA_COL',
    timestamp_col => 'TIMESTAMP_COL'
    [, model => 'MODEL']
    [, id_cols => ID_COLS]
    [, horizon => HORIZON]
    [, confidence_level => CONFIDENCE_LEVEL]
    [, context_window => CONTEXT_WINDOW]
  )
The SELECT * returns every column AI.FORECAST produces, including the forecasted timestamp, the predicted value, and the upper and lower confidence bounds for each future point. A sample output row is shown after the example query below.
Required and Optional Arguments
Each argument controls a specific part of how the forecast is generated.
data_col: the name of the column containing the values to forecast, such as sales or trip counts.timestamp_col: the name of the column containing the timestamp, date, or datetime for each row.model: the TimesFM model version to use. Supported values include TimesFM 2.0 and TimesFM 2.5, with TimesFM 2.0 as the default.id_cols: an array of column names used to forecast multiple time series in a single query, such as forecasting sales separately per store or per product.horizon: the number of future time points to forecast.confidence_level: sets the width of the confidence interval returned with each forecasted value.context_window: controls how many recent historical data points the model uses. TimesFM 2.0 supports 64 up to 2048 points, and TimesFM 2.5 supports 64 up to 15360 points.
Example Query Using Public Data
The example below applies the syntax above to a real table. It uses a subquery to group raw trip records into hourly totals first, since AI.FORECAST needs one row per time point rather than individual event rows. This example forecasts hourly bike share trips for each subscriber type using BigQuery’s public San Francisco bikeshare dataset.
SELECT * FROM AI.FORECAST(
  (
    SELECT
      TIMESTAMP_TRUNC(start_date, HOUR) as trip_hour,
      subscriber_type,
      COUNT(*) as num_trips
    FROM `bigquery-public-data.san_francisco_bikeshare.bikeshare_trips`
    WHERE start_date >= TIMESTAMP('2018-01-01')
    GROUP BY TIMESTAMP_TRUNC(start_date, HOUR), subscriber_type
  ),
  horizon => 720,
  confidence_level => 0.95,
  timestamp_col => 'trip_hour',
  data_col => 'num_trips',
  id_cols => ['subscriber_type']
);
This query groups trips into hourly buckets per subscriber type, then forecasts the next 720 hours (30 days) of trip counts with a 95 percent confidence interval.
Sample Output Row
Each row in the result represents one forecasted time point for one subscriber type. A single row looks like this:
| subscriber_type | forecast_timestamp | forecast_value | confidence_level | prediction_interval_lower_bound | prediction_interval_upper_bound |
|---|---|---|---|---|---|
| Subscriber | 2018-06-01 09:00:00 UTC | 42.3 | 0.95 | 31.7 | 52.9 |
forecast_value is the predicted count for that hour, while the lower and upper bound columns show the range the model is 95 percent confident the actual value will fall within. Wider gaps between the two bounds mean less certainty for that specific point.
Steps to Run Your Own Forecast
Follow these steps to apply AI.FORECAST to your own dataset in BigQuery.
- Open the BigQuery console and select the project that contains the dataset and table you want to forecast from.
- Write a query that returns your data with two required columns: one for the timestamp and one for the numeric value to forecast.
- If your data covers multiple entities, such as different stores or products, include an ID column to separate them.
- Wrap that query inside
AI.FORECAST(), settingdata_col,timestamp_col, andhorizonto match your data. - Run the query. The output includes one row per forecasted time point, in the same shape as the sample output row above.
- Adjust
context_windoworconfidence_levelif the forecast looks too sensitive to noise or the confidence bounds are too wide to be useful.
What Causes Forecast Errors or Gaps
A few common issues can affect forecast quality or cause the query to fail.
- Missing dates or gaps in the time series, which can cause BigQuery to misread the data’s frequency as weekly or monthly instead of daily.
- Using a
context_windowvalue outside the supported list for the selected model (64, 128, 256, 512, 1024, or 2048 for TimesFM 2.0; those plus 4096, 8192, or 15360 for TimesFM 2.5). - Forecasting a data column with a data type that AI.FORECAST does not support.
Frequently Asked Questions
Does AI.FORECAST require training a model first?
No. AI.FORECAST uses Google’s pretrained TimesFM model, so it can generate forecasts directly from your data without a separate training step.
Can AI.FORECAST forecast multiple time series at once?
Yes. Passing one or more column names to the id_cols argument lets a single query forecast separate time series, such as sales per store, in one call.
What is the difference between AI.FORECAST and ML.FORECAST?
AI.FORECAST uses the built-in TimesFM model and does not require creating a model resource. ML.FORECAST is used with an ARIMA_PLUS model that you create and train yourself, which also lets you decompose the series into trend and seasonality components.
How far into the future can AI.FORECAST predict?
The horizon argument sets the number of future time points to forecast, and there is no fixed cap stated for it, but accuracy generally drops the further out the forecast extends since the model has less reliable pattern data to extrapolate from at longer horizons.
Does AI.FORECAST work with daily, weekly, or monthly data, or only hourly data?
AI.FORECAST works with any consistent time interval, including daily, weekly, or monthly data, as long as the timestamp column follows that interval evenly. Gaps or inconsistent spacing between timestamps can cause BigQuery to misjudge the interval and produce an inaccurate forecast.
Related Guides
- Hermes Agent Not Working? Common Errors and How to Fix Them
- Hermes Agent Windows Install: Tips, Tricks, and Best Practices Guide
- How to Enable GPU-P (GPU Partitioning) in Hyper-V on Windows Server
More Guides

