Hitting F5 and seeing the error “Unable to start debugging. The startup project could not be launched” stops your workflow cold. This error is not tied to a specific programming language or project type. It can appear in C#, C++, VB.NET, or ASP.NET projects alike. The root cause almost always involves a misconfiguration in your project settings, a corrupted launch profile, a permission issue, or interference from security software.
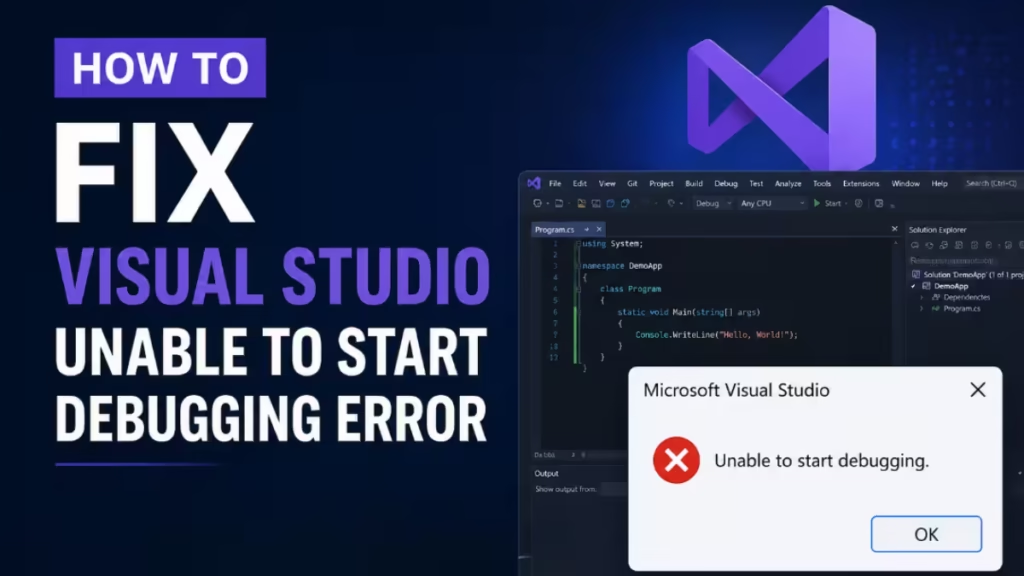
This guide covers every targeted fix, in order of how often each one resolves the problem.
1. Set the Correct Startup Project and Enable Debugging
Visual Studio needs to know exactly which project to launch when you press F5. If a solution has multiple projects and none is marked as the startup project, or if debugging is disabled for that project, the debugger has nothing to attach to.
- In Solution Explorer, right-click your main project.
- Select Set as Startup Project.
- Right-click the same project again and choose Properties.
- Open the Debug tab (or the Web tab for web projects).
- Confirm that Enable Debugging is checked. For C++ projects, check under Debugging > Launch. For Python or Node.js, check Enable native code debugging if needed.
- Click Save and press F5.
Visual Studio displays the startup project in bold in Solution Explorer. If your target project is not bold, it is not the active startup project.
2. Run Visual Studio as Administrator
Some project types, including those that interact with IIS, Windows services, or system-level components, require elevated privileges to bind to ports or attach the debugger to a running process.
- Close Visual Studio completely.
- Open the Start Menu and search for Visual Studio.
- Right-click the result and select Run as administrator.
- Open your solution and press F5.
If this resolves the error, configure Visual Studio to always run elevated by right-clicking its shortcut, going to Properties > Compatibility, and checking Run this program as an administrator.
3. Check the Debug Configuration in Project Properties
An incorrect output type or a misconfigured start action in your project settings prevents the debugger from finding anything to launch.
- Right-click your startup project in Solution Explorer and select Properties.
- Open the Application tab.
- Confirm the Output type matches your project. A desktop app needs Windows Application or Console Application, not Class Library. A Class Library has no entry point and cannot be launched by the debugger.
- Open the Debug tab (or Debug > General in newer Visual Studio versions).
- Confirm the Start action points to your project or the correct executable path.
- Save and press F5.
4. Delete and Regenerate launchSettings.json
The launchSettings.json file stores launch profiles, environment variables, and application URLs for the debugger. A corrupted or incorrect entry in this file stops the debugger from attaching to your application. Deleting it forces Visual Studio to regenerate a clean copy based on your current project configuration. This fix applies to any project type that uses a web server or a custom launch profile.
- Close Visual Studio completely.
- Open File Explorer and navigate to your project folder.
- Open the Properties subfolder inside your project directory.
- Locate
launchSettings.jsonand delete it. - Reopen Visual Studio and load your solution.
- Go to Build > Rebuild Solution.
- Press F5. Visual Studio regenerates the file automatically.
For non-.NET projects, the file may also appear inside the .vs folder at the solution root.
5. Delete the .vs Folder and Rebuild
The hidden .vs folder stores local solution settings, IntelliSense caches, and debug state. Corruption inside this folder can block the debugger from starting even when everything else looks correct.
- Close Visual Studio.
- Open File Explorer and navigate to your solution’s root folder.
- Enable Show hidden items under the View tab.
- Delete the entire
.vsfolder. - Reopen your solution in Visual Studio.
- Rebuild the solution and press F5.
Visual Studio recreates the .vs folder automatically on the next open. This does not affect your source code or project files.
6. Disable Antivirus Real-Time Protection or Add Exclusions
Antivirus programs, including Windows Defender, can block the Visual Studio debugger from creating temporary files, writing to output folders, or attaching to running processes. This affects all project types and all programming languages.
Step 1: Test by disabling real-time protection temporarily
In Windows Security, go to Virus and threat protection > Manage settings and turn Real-time protection off. Press F5 in Visual Studio.
Step 2: If debugging works, re-enable protection and add these exclusions
In Windows Security, go to Virus and threat protection > Manage settings > Exclusions > Add an exclusion and add the following paths:
- Visual Studio installation folder:
C:\Program Files\Microsoft Visual Studio\2022\ - Your project source code folder
- Debug output folders:
bin\Debug\,out\Debug\,__pycache__\,node_modules\ - Remote debugger:
C:\Program Files\Microsoft Visual Studio\2022\Common7\IDE\Remote Debugger\
For third-party antivirus, add the same paths through your software’s exclusions or whitelist settings. Also confirm Windows Firewall allows both Visual Studio and Remote Debugger under Control Panel > Windows Defender Firewall > Allow an app through Windows Firewall.
7. Repair IIS Express (for Web Projects)
Web projects that use ASP.NET, Node.js, or Python rely on IIS Express as the default web server for local debugging. If IIS Express is corrupted or missing components, Visual Studio cannot start the web host and the debugger fails to attach. Similarly, if the language runtime itself is damaged, reinstalling it restores the debug pipeline.
- Open Control Panel and go to Programs > Programs and Features.
- Scroll to IIS Express, select it, and click Change or Repair.
- After the repair finishes, address the runtime for your project type:
- Restart your PC and test debugging again.
If IIS Express does not appear in Programs and Features, download the latest version directly from the Microsoft IIS.net site and reinstall it.
8. Repair Your Visual Studio Installation
A corrupted Visual Studio installation can damage debugger components at a deeper level than the .vs cache or launch settings. The Visual Studio Installer can repair these files without touching your extensions or project files.
- Close Visual Studio.
- Open the Visual Studio Installer from the Start Menu.
- Find your installed version and click the three-dot menu next to it.
- Select Repair.
- Allow the repair to complete, then restart your PC.
- Open your solution and press F5.
If the repair does not resolve the error, a clean uninstall and reinstall of Visual Studio is the final option.
The “Visual Studio unable to start debugging” error points to a small set of real causes: a wrong startup project, a corrupted launch profile, missing permissions, security software interference, or a damaged IIS Express or Visual Studio installation. Work through the fixes above in order. The first four steps resolve this error for the majority of developers. If the issue survives all eight fixes, a clean Visual Studio reinstall is the definitive solution.

