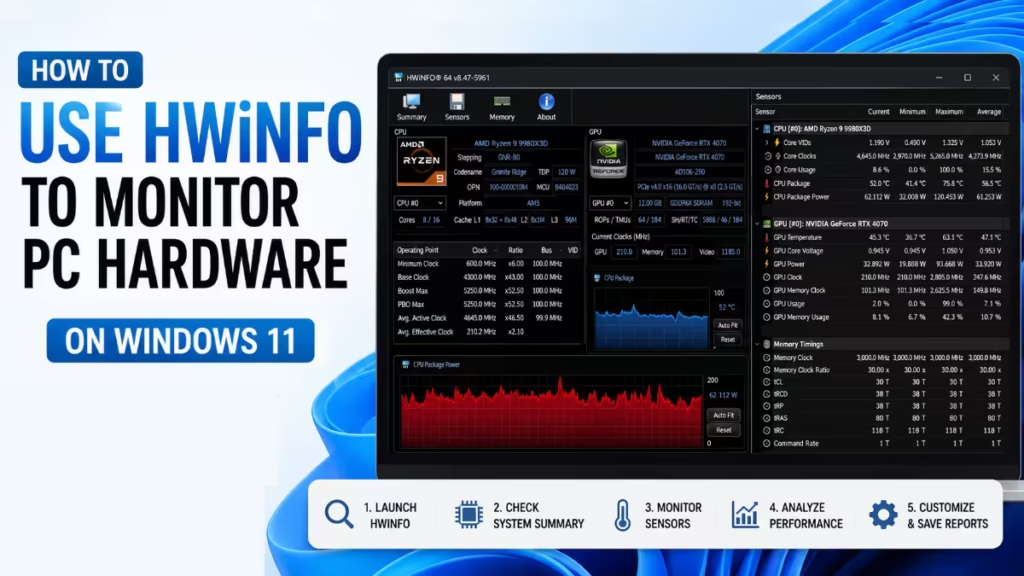
HWiNFO is a free hardware monitoring tool for Windows that reads data from every sensor inside your PC, covering CPU temperatures, GPU load, fan speeds, voltage, drive health, and much more. It goes far beyond what Task Manager or even CPU-Z can show you. This guide walks you through downloading HWiNFO, understanding its interface, and using it to monitor your hardware on Windows 11.
What Is HWiNFO
HWiNFO (also written HWiNFO64 for 64-bit systems) is a professional system information and real-time monitoring tool. It supports Windows 11, Windows 10, and goes all the way back to Windows 95. The tool collects data from hardware sensors and presents it as current, minimum, maximum, and average values so you can track what your components are doing under load.
It does not collect personal information and does not transmit data over the network. It runs with very low overhead, which means monitoring itself does not meaningfully affect the readings you see.
How to Download and Install HWiNFO
Go to the HWiNFO download page and pick your preferred version. You have two options: the installer and the portable version. The portable version works without installation, which is useful if you are on a shared or corporate machine. The installer is the more convenient choice for personal use. HWiNFO is also available directly from the Microsoft Store if you prefer to install it that way.
Run the installer and click through the setup. No bundled software comes with it. Once installed, launch HWiNFO64 from the Start menu or desktop shortcut.
If you downloaded the portable ZIP, extract it to any folder. Use HWiNFO64.exe on modern 64-bit Windows 11 systems. If you are unsure whether your system is 64-bit, go to Settings > System > About and check under Device Specifications.
How to Choose the Right HWiNFO Startup Mode
When HWiNFO launches, it shows three options: Sensors-only, Summary-only, and a full startup that opens both windows. For most users, Sensors-only is the most useful mode. This guide uses the full startup so you can explore both the summary and sensor views.
The Summary window gives you a quick overview of your CPU, motherboard, RAM, and GPU. It shows supported CPU features, current clock speeds, installed memory amount, and basic graphics card specs. Hover over any item to see a tooltip explaining what it means.
The Main window on the left shows a hardware tree with categories like CPU, Motherboard, Memory, GPU, Storage, Network, Ports, and Battery. Clicking any category on the left shows full detail on the right, including exact model numbers, BIOS version, memory timings, USB controller types, chipset details, and more. This is the place to check before upgrading RAM, flashing a BIOS update, or verifying hardware compatibility.
How to Use HWiNFO Sensor Mode on Windows 11
Click Sensors in the main window toolbar to open the sensor panel. This is where HWiNFO becomes most useful for ongoing monitoring.
The sensor panel shows a large table organized by hardware section, including CPU, VRM, motherboard, GPU, drives, fans, and voltages. Each row shows four columns: current value, minimum recorded, maximum recorded, and average since monitoring started. Click the two blue arrow buttons at the bottom left to expand or collapse the sensor columns and adjust the view to fit your screen.
To reset the minimum and maximum values at any point, click the clock icon at the bottom of the sensor window. This is useful when you want to start fresh before running a game or benchmark.
How to Monitor CPU Temperature and Throttling in HWiNFO
Scroll down to the CPU section in the sensor panel. Expand Core Temperatures to see the temperature of each individual core. For most users, the CPU Package temperature is the most useful single figure since it represents the overall processor heat.
Keep CPU package temperature below 80 degrees Celsius during gaming or heavy workloads. At 90 degrees, most processors begin thermal throttling, which means they reduce clock speed to cool down. HWiNFO shows a dedicated row called Thermal Throttling or HTC that reads Yes or No in real time. If that value flips to Yes while you play a game, your CPU cooling is not keeping up.
To watch throttling without keeping the full window open, right-click the throttling row and select Add to Tray. HWiNFO adds a small icon to the Windows system tray that shows the current value when you hover over it.
To visualize how a temperature or power value changes over time, right-click any sensor row and select Show Graph. The graph updates in real time so you can see whether a value spikes or stays stable as you change workloads.
How to Monitor GPU, RAM, and Storage in HWiNFO
Scroll past the CPU section to find GPU readings. HWiNFO shows GPU core temperature, VRAM temperature, GPU load percentage, fan speed, power draw, core clock, and memory clock. Current, minimum, maximum, and average values appear for each.
The Memory or DIMM section shows RAM temperatures and voltages. If you have overclocked your RAM through XMP or DOCP profiles in the BIOS, this section lets you confirm the modules run at the correct speed and voltage without instability.
For storage, scroll down to the drive section. HWiNFO reads S.M.A.R.T. data from your SSD or HDD and shows drive temperature, total bytes written, total bytes read, and a drive life remaining percentage. That life estimate uses total write data against the drive’s rated endurance. A drive with 69% life remaining after 100 terabytes written is still in good shape. If the percentage drops low or S.M.A.R.T. errors appear, the drive needs attention.
How to Set Up Alerts and Logging in HWiNFO
To receive a notification when a sensor crosses a threshold, open Configure Sensors from the sensor window toolbar and go to the Alerts tab. Enable alerting, scroll through the sensor list, select the one you want to watch such as GPU temperature, and set a threshold value. You can configure HWiNFO to play a sound or show a warning window when the value exceeds the limit.
To log sensor data over time, click the CSV logging button (the spreadsheet icon) at the bottom of the sensor window. HWiNFO writes all sensor values to a CSV file at your chosen interval. Open that file later in Excel or a spreadsheet tool to analyze temperature trends, power spikes, or fan behavior during a long gaming session or stress test.
How to Customize the HWiNFO Sensor View
Open Configure Sensors and go to the Layout tab. From here, you can drag sensor rows up or down to put the ones you care about at the top. If you reorganize and want to undo everything, click Restore Original Order inside the same Layout tab.
The General tab inside Configure Sensors lets you change temperature units from Celsius to Fahrenheit. You can also toggle entire sensor categories on or off so the panel only shows what you actually use.
To reduce how often readings refresh, find the Global Polling Period setting in Configure Sensors. The default is 2000 milliseconds. You can lower it to around 1000 milliseconds for faster updates, but going much below that causes the monitoring tool itself to consume measurable CPU resources, which skews the readings.
For integration with games, HWiNFO works alongside MSI Afterburner and RivaTuner Statistics Server. Set up that integration to display HWiNFO sensor values as an on-screen overlay while you play, showing CPU temperature, GPU load, frame time, and fan speeds directly over the game.
How to Check for Windows Hardware Errors in HWiNFO
Scroll to the very bottom of the sensor panel to find the WHEA (Windows Hardware Error Architecture) section. This section logs hardware-level errors that Windows records internally. A healthy system shows zero errors here. If you see error counts, your hardware may have stability problems that need further investigation, whether from RAM issues, a degraded CPU, or power supply problems.

