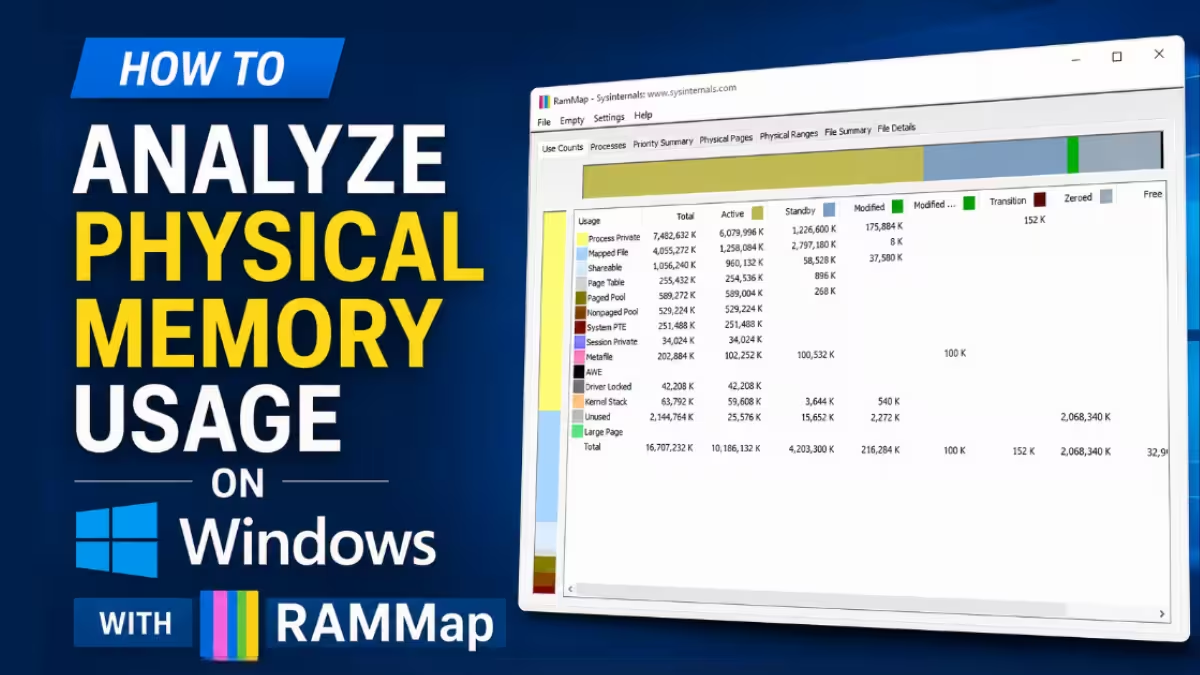
RAMMap is a free diagnostic utility from Microsoft Sysinternals that gives you a detailed breakdown of how Windows allocates physical RAM. It runs on Windows Vista and later and works on Windows Server 2008 and later. If your system feels slow despite having enough RAM, or you want to see exactly what is consuming memory at the kernel and driver level, RAMMap answers those questions in a way Task Manager never can.
How RAMMap Maps Physical Memory
RAMMap organizes physical memory data across seven tabs, each focused on a different angle of memory usage.
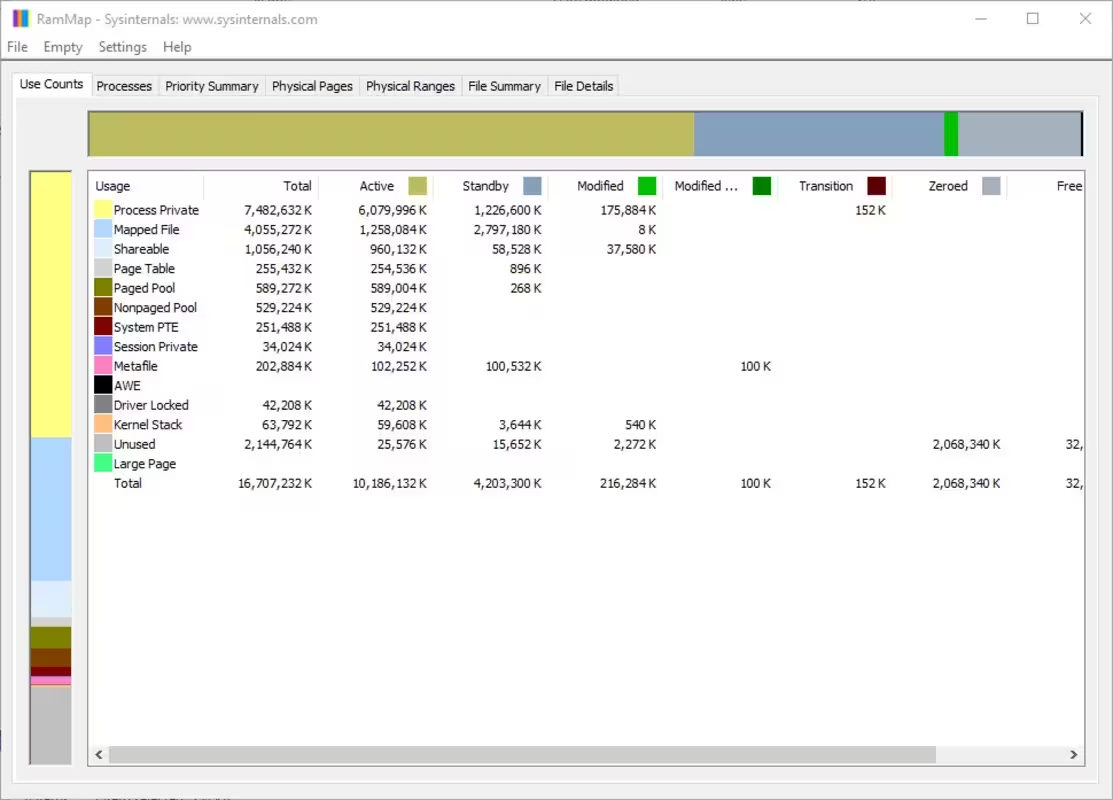
Use Counts: Gives a summary of how memory is distributed by type and paging list. This is the first tab to check when you want a quick overview of how RAM is split between active pages, standby pages, and modified pages.
Processes: Shows the working set size for each running process. This tells you how much physical RAM each process actively holds, which helps you spot memory-hungry applications.
Priority Summary: Breaks down the standby list by priority level. Windows assigns priorities to memory pages so it can reclaim low-priority standby pages first when RAM runs low. This tab makes those priorities visible.
Physical Pages: Maps every single page of physical memory to its current use. This is the most granular view RAMMap offers and is useful when you need to trace exactly where every megabyte goes.
Physical Ranges: Lists the physical address ranges of installed RAM. This tab is primarily useful when diagnosing hardware-level memory configuration issues or checking for reserved regions.
File Summary: Shows which files currently have data cached in RAM, along with how much space each file occupies. This tab helps you understand how the system file cache behaves under different workloads.
File Details: Goes deeper than File Summary by listing the individual physical pages associated with each cached file. Use this when you need to pinpoint which specific pages belong to a particular file on disk.
How to Download and Run RAMMap
You can get RAMMap directly from the Microsoft Sysinternals website. The download is a small ZIP file under 750 KB. Extract it and run RAMMap.exe as an administrator. No installation is required.
Alternatively, you can run RAMMap directly from Sysinternals Live without downloading anything. Open a Run dialog with Win + R, type \\live.sysinternals.com\tools\RAMMap.exe, and press Enter.
How to Use RAMMap for Memory Troubleshooting
1. Check Overall Memory Allocation First
Open RAMMap and go to the Use Counts tab. Look at the columns labeled Active, Standby, Modified, and Free. If standby memory is very high but free memory is near zero, Windows is holding a large file cache and will reclaim it as needed. If modified memory stays high for a long time, the disk write queue may be a bottleneck.
2. Identify Memory-Heavy Processes
Switch to the Processes tab and sort by Total to see which processes hold the most physical RAM. This view is more accurate than Task Manager for identifying real physical memory consumption because it shows the working set rather than virtual memory.
3. Inspect the File Cache
Go to File Summary and sort by Total to see which files consume the most RAM in the cache. On workstations running database software or media applications, you will often find that large data files dominate the standby list. This is expected behavior, but it helps confirm whether the cache is filling with useful data or stale file reads.
4. Refresh and Compare Snapshots
RAMMap includes a refresh button that updates all tabs with current data. For iterative testing, use File > Save to capture a snapshot of the current memory state, then reload it later with File > Open to compare before-and-after results. This workflow is particularly useful when you need to measure the memory impact of installing new software or enabling a Windows feature.
5. Empty the Standby List
RAMMap includes an Empty menu that lets you flush the standby list, working sets, modified page list, or all of the above. Use Empty > Empty Standby List if you want to measure true application memory demand without cached file data inflating the numbers. This does not harm the system. Windows rebuilds the cache automatically as it reads files.
Limitations of RAMMap
RAMMap is a read-only analysis tool. It does not optimize memory, set limits on processes, or run in the background. Every analysis requires a manual refresh or snapshot. The tool also has a steep learning curve if you are unfamiliar with Windows memory management concepts. For background reading on how the Windows memory manager works internally, the official reference is Windows Internals by Mark Russinovich and David Solomon.

