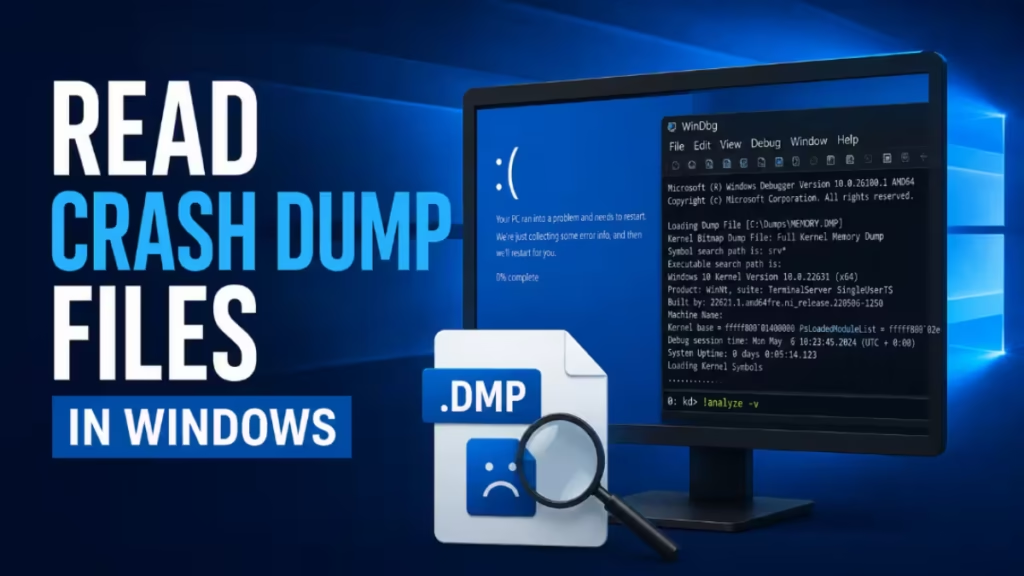
When Windows crashes with a blue screen error, it automatically writes a dump file that records exactly what was happening in memory at the moment of the crash. Reading that file tells you the stop code, the faulty driver, and often the exact module that triggered the crash. This guide covers two real tools that actually work: WinDbg (Microsoft’s official debugger) and BlueScreenView (a lightweight Nirsoft utility). Both are free.
What Is a Windows Crash Dump File
Windows writes dump files to C:\Windows\Minidump by default after every BSOD. Each file carries:
- The stop code and its parameters
- A list of loaded drivers at crash time
- The processor context for the CPU that stopped
- Process and kernel context for the thread that triggered the crash
- The kernel-mode call stack
Minidump files (.dmp) are the compact version. They are easier to open and carry everything you need to identify the root cause.
Method 1: Read Crash Dump Files Using WinDbg
WinDbg is Microsoft’s official debugging tool. It reads all dump file formats including minidumps, kernel dumps, and complete memory dumps.
Step 1: Install WinDbg Preview
- Open the Microsoft Store on your PC.
- Search for WinDbg Preview or go directly to the Store listing.
- Click Get and then Install.
WinDbg Preview is the modern version. Do not use the older WinDbg from the Windows SDK unless you specifically need it.
Step 2: Configure the Symbol Path
Without a symbol path, WinDbg cannot resolve function names and the analysis output will be mostly hexadecimal addresses with no context. Set it before opening any dump file.
- Open WinDbg Preview as administrator (right-click > Run as administrator).
- Click File > Settings > Debugging Settings.
- In the Default symbol path field, enter:
srv*C:\Symbols*https://msdl.microsoft.com/download/symbols- Click OK.
The C:\Symbols part is a local cache folder. WinDbg downloads symbols from Microsoft’s servers the first time and caches them locally for faster future analysis. You can use any folder path you prefer.
Step 3: Open the Dump File
- Click File > Start Debugging > Open Dump File.
- Navigate to
C:\Windows\Minidump. - Select the
.dmpfile you want to analyze and click Open.
If Windows is installed on a drive other than C:, check %SystemRoot%\Minidump for the correct path. You can also open compressed .cab or .zip archives containing dump files directly without extracting them first.
Step 4: Run the Verbose Analysis Command
Once the dump loads, type the following command in the command bar at the bottom of the window and press Enter:
!analyze -vThe -v flag runs verbose mode. Without it, the output is minimal. Analysis can take anywhere from a few seconds to a couple of minutes depending on file size and symbol download speed.
Step 5: Read the Bugcheck Analysis Output
After the command completes, scroll through the output and look for these specific sections:
BUGCHECK_STRshows the stop code in a readable format, for exampleDRIVER_IRQL_NOT_LESS_OR_EQUALorMEMORY_MANAGEMENT.MODULE_NAMEidentifies the specific driver or module that caused the crash. This is the key field. If it shows something likenvlddmkm, that points to an NVIDIA graphics driver issue.IMAGE_NAMEgives the filename of the responsible module, for examplentoskrnl.exe,win32k.sys, or a third-party driver likeaswSP.sys.FAILURE_BUCKET_IDprovides a unique crash signature that groups similar crashes together and is useful for searching for known fixes.STACK_TEXTshows the call stack. Read it top to bottom. The top frame is where execution stopped. Look for third-party driver names in this stack since those are most likely the culprit.
If you remember the stop code from the blue screen itself, use Ctrl + F inside WinDbg to search the analysis output for that string directly.
Method 2: Read Crash Dump Files Using BlueScreenView
BlueScreenView by Nirsoft is faster to set up and better for quickly identifying the driver that caused a crash. It displays each dump file as a row, and the Caused By Driver column in the upper panel names the most likely culprit driver immediately on load.
Step 1: Download BlueScreenView
Go to https://www.nirsoft.net/utils/blue_screen_view.html and download one of two versions:
- Installer version: Click Download BlueScreenView with full install/uninstall support, run the setup file, and follow the prompts.
- Portable version: Click Download BlueScreenView (in Zip file), extract the archive, and run
BlueScreenView.exedirectly. No installation needed.
Step 2: Open BlueScreenView
Launch BlueScreenView. If it detects .dmp files at the default C:\Windows\MiniDump path, it loads them automatically. The upper panel lists every crash dump with its filename, crash date, stop code, and the driver involved.
Step 3: Change the Dump Folder If Needed
If BlueScreenView shows no files:
- Press Ctrl + O to open Advanced Options.
- Click Browse and navigate to your minidump folder.
- Click OK.
Common alternate locations:
C:\MiniDumpC:\Windows\MEMORY.DMP(full memory dump)C:\Users\[Username]\AppData\Local\CrashDumps(for app crashes)
Step 4: Identify the Crashing Driver
Start with the upper panel. Click any dump file in the list and check these two columns without scrolling anywhere:
- Caused By Driver: The driver BlueScreenView has identified as the most likely cause. This is the first column to check.
- Bug Check String: The stop code for that specific crash, for example
DRIVER_IRQL_NOT_LESS_OR_EQUALorNTFS_FILE_SYSTEM.
For deeper confirmation, look at the lower panel. It shows all drivers and modules loaded at crash time. Drivers highlighted in pink are the ones whose memory addresses appear in the crash stack. These are directly involved in the crash.
If a third-party driver name appears in pink (anything that is not a core Windows system file), that driver is the primary suspect. Note the exact filename and search for the latest version from the manufacturer.
Method 3: Check and Fix Your Dump File Settings
If Windows is not generating dump files at all, or if you want a more detailed dump type for analysis, check these settings.
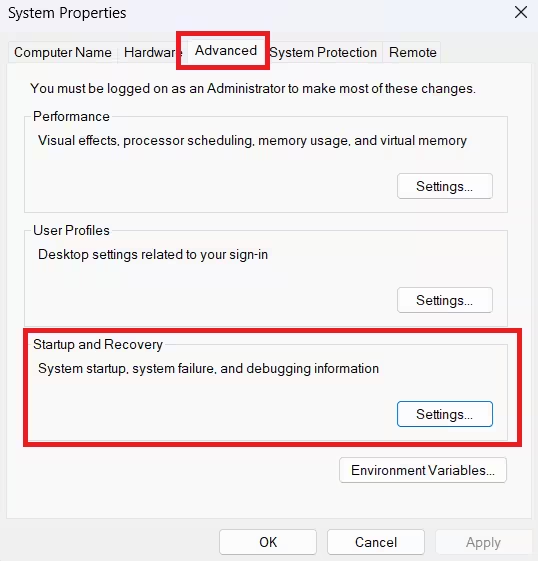
Step 1: Open Startup and Recovery Settings
- Press Windows + R, type
sysdm.cpl, and press Enter. - Click the Advanced tab.
- Under Startup and Recovery, click Settings.
Step 2: Select the Right Dump Type
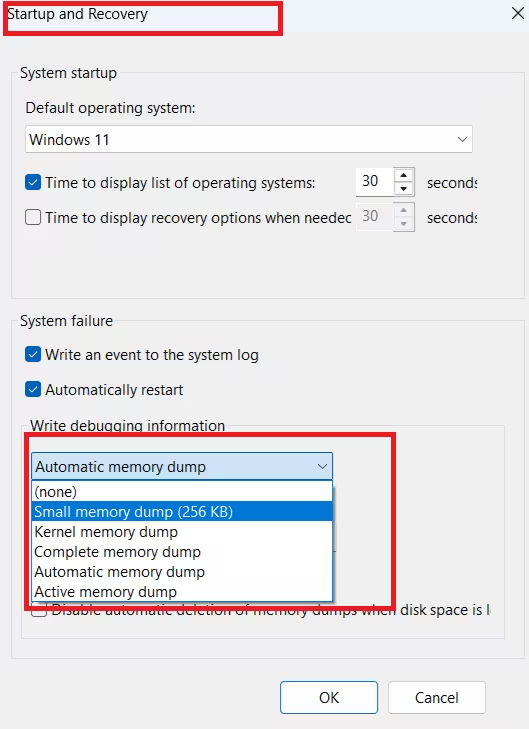
The Write debugging information dropdown controls what type of dump Windows creates. For most crash troubleshooting, use:
- Small memory dump (256 KB): Creates a minidump in
C:\Windows\Minidump. Lightweight and works with both WinDbg and BlueScreenView. Best for routine BSOD analysis. - Kernel memory dump: Captures kernel memory only. Larger than a minidump but more detailed. Useful when the minidump lacks enough stack context.
- Automatic memory dump: Windows decides the size dynamically. Good default for most systems.
- Complete memory dump: Captures all RAM. Can be several gigabytes. Use only when other dump types fail to reveal the cause.
Step 3: Verify the Dump File Path
The Dump file field shows where Windows saves the crash dump. A value of %SystemRoot%\Minidump means C:\Windows\Minidump on a standard install. If the path points to a drive with low disk space, Windows may silently skip writing the dump file. Change the path to a drive with at least 1 GB free.
Step 4: Disable Automatic Overwrite If Needed
For kernel memory dump, complete memory dump, and automatic memory dump types, Windows overwrites the previous file on each new crash. If you want to keep multiple dumps for comparison, uncheck Overwrite any existing file.
Small memory dump files are never overwritten. Windows appends a new dated file each time.
Step 5: Click OK
Click OK twice to apply. Changes take effect on the next system crash with no reboot required.
Method 4: Use Driver Verifier to Catch the Faulty Driver
Approximately 75% of blue screen errors on Windows trace back to driver issues. Driver Verifier runs in real time and applies stress tests to drivers to force a crash with a more specific stop code if a driver is misbehaving. Use it when dump file analysis points to a driver but you are not sure which one.
Step 1: Open Driver Verifier
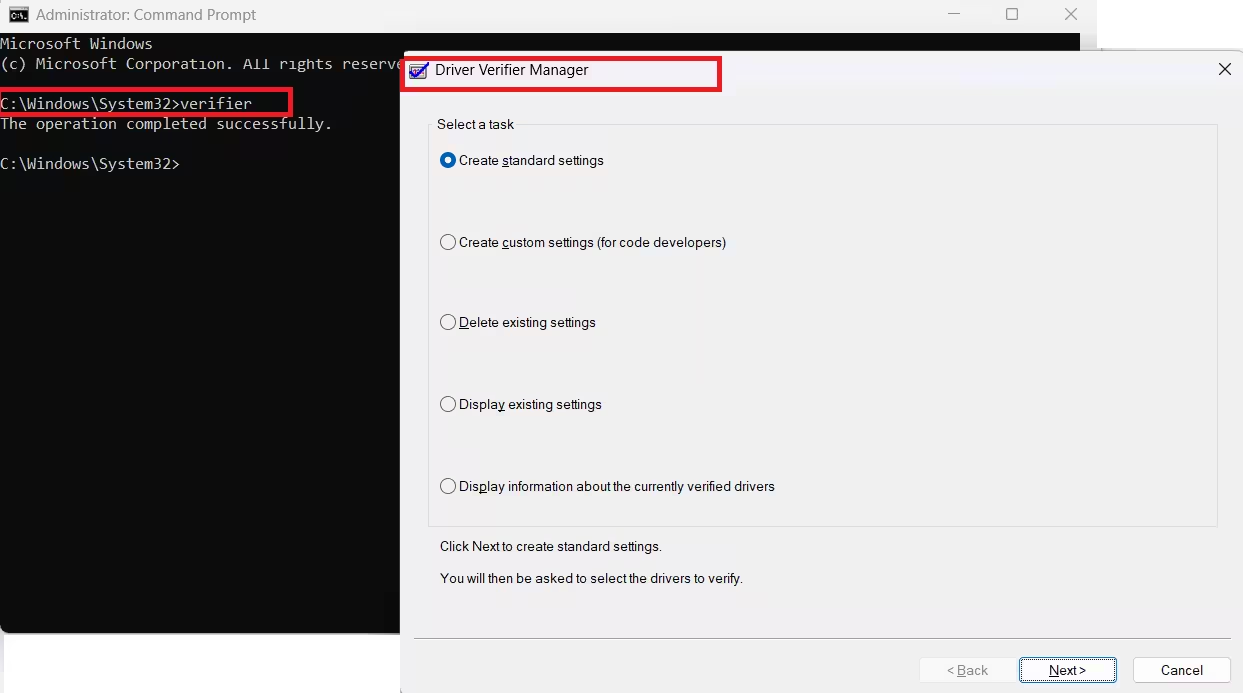
- Open Command Prompt as administrator.
- Type
verifierand press Enter. - The Driver Verifier Manager window opens.
Step 2: Configure Verifier Settings
- Select Create standard settings and click Next.
- On the next screen, select Select driver names from a list and click Next.
- Click Load Driver Information.
The list shows all currently loaded drivers. Sort by Provider to separate Microsoft drivers from third-party ones. Check only the third-party drivers you suspect. Verifying fewer drivers at a time makes it easier to isolate the bad one.
If the minidump already named a specific driver via MODULE_NAME or IMAGE_NAME, check only that driver.
- Click Finish and restart the PC.
Step 3: Trigger and Read the Verifier Crash
If a checked driver violates memory rules or behaves incorrectly, Windows forces an immediate crash with a highly specific stop code. Open WinDbg on the resulting dump file and run !analyze -v. The bugcheck analysis will now name the exact driver function that failed.
Step 4: Disable Driver Verifier After Testing
Driver Verifier causes crashes by design. Disable it after testing.
- Open Command Prompt as administrator.
- Type
verifier /resetand press Enter. - Restart the PC.
If your system crashes at every boot with Verifier enabled, boot into Safe Mode, open Command Prompt, run verifier /reset, and reboot normally.
FAQs
Where are Windows crash dump files stored by default?
Windows saves minidump files to C:\Windows\Minidump. Each file uses the format MiniDDMMYY-NN.dmp where DD, MM, and YY are the crash date and NN is a sequence number. Full memory dumps go to C:\Windows\MEMORY.DMP and get overwritten on each new crash.
WinDbg shows MODULE_NAME as “nt” or “ntkrnlmp” — what does that mean?
This means the crash occurred inside the Windows kernel itself rather than a third-party driver. Common causes include faulty RAM, corrupted system files, or a hardware issue. Run Windows Memory Diagnostic (mdsched.exe) to check RAM, and run sfc /scannow in an elevated Command Prompt to repair system files.
BlueScreenView shows no files even though my PC has crashed why?
Windows requires a properly configured page file on the system drive to write dump files. Open sysdm.cpl > Advanced > Performance Settings > Advanced tab and confirm virtual memory is set to System managed size on the C: drive. Also verify the dump type is not set to None in Startup and Recovery settings.
What does FAILURE_BUCKET_ID in WinDbg output mean?
It is a short crash signature that groups identical or similar crash patterns. Copy the full string and search it on Microsoft’s documentation or community forums to find known fixes or updates related to that specific crash pattern.
Can I read dump files from another PC on my own machine?
Yes. Copy the .dmp files to your machine and open them in WinDbg or BlueScreenView the same way you would open local dump files. Make sure your symbol path points to Microsoft’s symbol server so WinDbg can resolve the correct driver names from the source machine.
My PC crashes too fast to read the blue screen, how do I capture the stop code?
Windows auto-restarts after a BSOD by default. Disable this in sysdm.cpl > Advanced > Startup and Recovery Settings by unchecking Automatically restart. Then the next BSOD stays on screen long enough to read. Alternatively, open the most recent dump file in BlueScreenView and check the Bug Check String column.

